
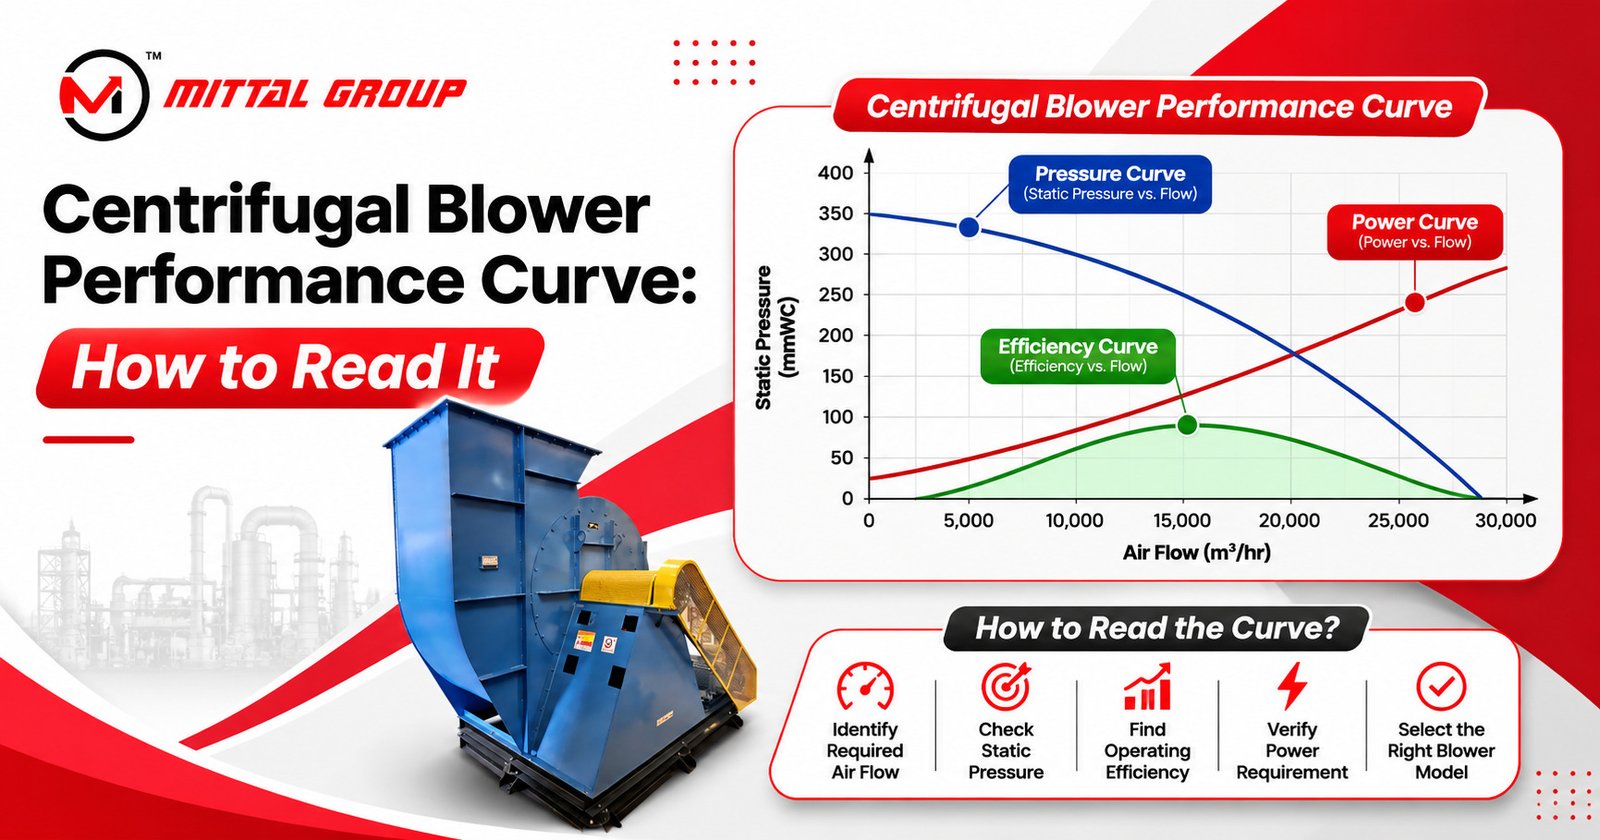
A centrifugal blower performance curve is a graph that shows how much static pressure a blower develops, how much power it absorbs and how efficiently it runs at every airflow, at one fixed speed. To read it, find your required airflow on the horizontal axis, move up to the pressure curve, and check that this point lies on your system curve, close to the peak of the efficiency curve, and below the motor's rated power.
Centrifugal blowers move air and gas through almost every industrial process: boiler draft, dust collection, drying, cooling, fume extraction, pneumatic conveying and building ventilation. In most plants they are also among the largest continuous users of electricity. A blower that is even slightly mismatched to its system wastes power every hour it runs, and in the worst cases it vibrates, surges or trips its motor.
The single most useful document for avoiding those problems is the blower performance curve. Every reputable manufacturer publishes one for each model and speed, and it tells you, far more precisely than a catalogue table, what the blower will actually do in your duct system.
Yet the curve is often skipped. Many enquiries we receive at Mittal Blowers state only "10,000 CMH" or "5 HP", with no pressure figure at all. This guide, written from our design team's experience building centrifugal fans in Ahmedabad since 2005, explains what each line on a centrifugal fan performance curve means, how to read one step by step, and how to use it to select the right blower.
Understanding the Centrifugal Blower Performance Curve
A fan performance curve is a graph of a blower's behaviour across its full operating range at a fixed speed (RPM), air density and inlet condition. The horizontal axis is always airflow. The vertical axes carry the other measured quantities.
A complete curve sheet usually shows four lines:
- Pressure curve: static or total pressure developed at each airflow.
- Power curve: shaft power absorbed by the impeller at each airflow.
- Efficiency curve: how well the blower converts shaft power into air power.
- System curve (often added by the selector): the pressure your ductwork, filters and equipment need at each airflow.
The curve sheet also states the conditions it was drawn for: speed, air density (standard air is 1.2 kg/m³, at about 20°C and sea level), impeller diameter, and whether the pressure shown is static or total. Without those notes, a curve cannot be compared with another.
Reputable curves are built from tests on a laboratory rig to a recognised code, such as AMCA 210 or ISO 5801, rather than calculated alone. Ask your supplier which standard the curve is based on.
Why reading it correctly matters
The curve is where three decisions meet: whether the blower will deliver the airflow your process needs, how much it will cost to run, and whether it will run stably and safely for years. Reading it wrongly leads to the most common fan problems in industry: undersized fans that never reach design flow, oversized fans throttled by dampers that waste energy, and fans running in an unstable zone that vibrate and fail early.
Key Components of the Performance Curve
Flow rate (CFM or m³/h)
Airflow is the volume of air the blower moves per unit time. US and many international curves use cubic feet per minute (CFM); Indian and European curves usually use cubic metres per hour (m³/h or CMH). One CFM equals about 1.7 m³/h.
Airflow is always quoted at the blower inlet and at the stated density. If your gas is hot, the blower still moves the same volume, but a smaller mass of air.
Pressure (inches of water gauge or mm WC)
Pressure is the resistance the blower can overcome. It is shown in inches of water gauge (in WG) on US curves, and in millimetres of water column (mm WC) or pascals on Indian and European curves. One inch of WG equals 25.4 mm WC, or about 249 Pa.
Check which pressure is shown:
- Static pressure is what overcomes duct and equipment resistance. Most industrial selections are made on static pressure.
- Velocity pressure is the pressure of the moving air itself.
- Total pressure is static plus velocity pressure.
Mixing static and total pressure when comparing two offers is one of the most frequent errors in fan selection.
Efficiency (%)
Efficiency is the ratio of useful air power delivered to the shaft power absorbed. Curves may show static efficiency (based on static pressure) or total efficiency (based on total pressure); total efficiency is always the higher number. Peak efficiency depends heavily on impeller type, so read our comparison of forward curved vs backward curved impellers if you are choosing a wheel design.
Power consumption (HP or kW)
The power curve shows brake horsepower (BHP) or shaft kilowatts (kW) absorbed by the impeller at each airflow. One HP equals about 0.746 kW. This is shaft power only; motor and drive losses come on top, so the motor is chosen with a margin above the highest power the fan can reach in service.
The shape of the power curve matters. On backward curved and airfoil blowers, power rises to a peak and then falls, so the curve is called non-overloading. On forward curved and radial blowers, power keeps rising with airflow, so the motor can overload if system resistance drops.
How to Read a Blower Performance Curve
Step-by-step
Follow these steps on any manufacturer's curve sheet.
Step 1: Check the conditions. Note the speed, density, temperature, impeller diameter and whether pressure is static or total. Confirm they match your duty, or that corrections have been applied.
Step 2: Find your airflow. Locate your required airflow on the horizontal axis.
Step 3: Move up to the pressure curve. Draw a vertical line from that airflow to the pressure curve. Read across to the pressure axis. This is the pressure the blower develops at that flow.
Step 4: Compare it with your required pressure. If the blower's pressure at your airflow matches your calculated system pressure, the selection fits. If it is well above, the blower is oversized; if below, it will not reach design flow.
Step 5: Plot your system curve. System resistance rises roughly with the square of airflow. Plot your design point, then sketch the parabola through zero. The point where the fan curve crosses the system curve is the actual operating point.
Step 6: Read the efficiency. From the operating point, move to the efficiency curve. Ideally the operating point sits at or just to the right of the peak, the best efficiency point (BEP).
Step 7: Read the power. Move to the power curve to find shaft power at the operating point. Then check the maximum power anywhere along the curve, to confirm the motor cannot overload.
Step 8: Check the stable zone. Make sure the operating point is clear of the left-hand portion of the curve where pressure flattens or dips. Many manufacturers mark this zone as "do not select" or shade it.
Common mistakes to avoid
- Ignoring density. A curve at 20°C overstates pressure and power for a blower handling gas at 150°C. Correct for actual temperature and altitude.
- Comparing static and total pressure. Always compare like with like.
- Selecting at the edge of the curve. Points near shut-off risk surge; points near free delivery waste power and may overload some fan types.
- Adding too large a safety margin. A blower oversized "to be safe" runs throttled and inefficient. Add a sensible margin to calculated resistance, not a guess.
- Forgetting system effect. A bend or transition right at the inlet or outlet reduces real performance below the curve.
- Reading power as motor rating. The curve shows shaft power; select the motor above it with a margin for drive losses.
Centrifugal Blower Efficiency Curve
The centrifugal blower efficiency curve rises from zero at shut-off, peaks at the best efficiency point, and falls again towards free delivery. Its shape tells you how forgiving a blower is: a broad, flat peak tolerates changes in duty, while a sharp peak loses efficiency quickly if the system changes.
In the illustrative curve above, efficiency peaks near 10,000 m³/h. The power line peaks a little further right and then falls, which is the non-overloading pattern typical of a backward curved wheel.
Why it matters in selection
Efficiency is where running cost is decided. Because fan power follows the cube of speed, and because many blowers run 6,000 to 8,000 hours a year, a few points of efficiency make a large difference over a blower's life.
Use the efficiency curve to:
- Choose between two models that both meet the duty: the one whose operating point is nearer its BEP is usually the better buy.
- Choose the speed and impeller diameter that place the duty close to the peak.
- Check how efficiency will change if the process runs at reduced flow for part of the year.
- Compare offers honestly, by asking every supplier for efficiency at the same operating point and on the same basis (static or total).
Blower Pressure vs Airflow Curve
The blower pressure vs airflow curve is the heart of the performance curve. For a centrifugal blower at fixed speed, pressure is highest near shut-off and falls as airflow increases. The system, meanwhile, needs more pressure as airflow increases, because duct friction rises roughly with the square of velocity.
Where the two lines cross is the operating point. The blower cannot run anywhere else at that speed. This explains several field effects:
- A clogged filter or closed damper steepens the system curve, moving the operating point left: less airflow, more pressure.
- Leaking ducts or removed equipment flatten the system curve, moving the point right: more airflow and, on some fan types, more power.
- Changing speed shifts the whole fan curve. Under the fan laws, airflow changes with speed, pressure with speed squared and power with speed cubed. A 10% speed cut reduces power by about 27%.
This is also why a variable frequency drive (VFD) is the most efficient way to adjust airflow: it moves the fan curve to meet the system, instead of adding resistance with a damper.
The unstable region
On many blowers the pressure curve flattens or dips at low flow, to the left of peak pressure (the shaded zone in the chart). Operating there can cause surge: airflow pulses, noise rises and vibration increases. A correct selection keeps the operating point safely to the right of that peak.
Centrifugal Blower Selection Guide
This centrifugal blower selection guide brings the curve together with the other decisions a buyer must make.
Factors to consider
- Airflow: the process requirement, at the actual temperature.
- Static pressure: calculated from ducting, hoods, filters, scrubbers, cyclones or equipment, with a sensible margin.
- Gas condition: temperature, density, moisture, dust load and corrosiveness. Our centrifugal blower material guide and our guide to high temperature industrial fans cover material choice.
- Pressure class: our low pressure blowers cover about 20 to 150 mm WC, medium pressure blowers about 200 to 800 mm WC, and high pressure centrifugal blowers about 600 to 1,800 mm WC.
- Impeller type: backward curved for efficiency, radial for dust, forward curved for compact low-pressure duty.
- Arrangement and drive: direct or belt drive, single or double inlet, inlet and outlet orientation, and space available.
- Operating hours and control: long-running blowers justify higher efficiency and VFD control.
- Noise and site limits: sound levels, foundation and access for maintenance.
How to use performance curves for selection
- Ask for the curve at your actual speed and density, not only at standard air.
- Mark your design point and system curve on every offered curve.
- Choose the model whose operating point is closest to its BEP and well inside the stable zone.
- Check the motor against the maximum power on the curve, not only the duty point.
- For boiler and furnace duties, confirm that curves cover every load case; our ID, FD and PA fans are usually selected across several operating points.
- When no standard model fits well, a customized centrifugal blower can be designed around the exact duty.
Conclusion
A centrifugal blower performance curve turns a catalogue model into a prediction of how the blower will behave in your plant. Read together, the pressure, efficiency and power curves tell you whether a blower will deliver your airflow, how much it will cost to run, and whether it will run stably for years. The system curve shows where it will actually operate.
Selecting with the curve takes a few extra minutes, and it is the best protection against undersized, oversized or unstable blowers.
Want a second opinion on a curve or a selection? Mittal Blowers designs and manufactures centrifugal fans and blowers in Ahmedabad, with ISO 9001:2015 certification and ZED Gold recognition. Send us your airflow, pressure and gas details, or a curve you have been offered, and our engineers will check the selection. Request a quote, call +91 93135 37327, or download our catalogue.
Frequently Asked Questions
What is a centrifugal blower performance curve?
It is a graph showing the static pressure, power and efficiency of a blower at every airflow, at one fixed speed and air density. It shows what the blower will deliver in a real system.
How do you find the operating point on a fan performance curve?
Plot your system resistance curve on the same graph as the fan pressure curve. The point where they cross is the operating point: the airflow and pressure the blower will actually deliver.
What is the best efficiency point (BEP)?
The BEP is the airflow at which the blower converts shaft power into air power most efficiently. Selecting at or slightly to the right of the BEP gives the lowest running cost and the most stable operation.
Why does pressure fall as airflow increases?
At fixed speed, a centrifugal blower adds a limited amount of energy to the air. As more air passes through, less of that energy is available as static pressure, so the pressure curve slopes downward.
What happens if a blower operates to the left of peak pressure?
It may surge. Airflow becomes unstable, noise and vibration increase, and bearings and impellers can be damaged over time.
How does temperature affect a blower performance curve?
Hot gas is less dense, so the blower develops less pressure and absorbs less power at the same speed and volume. Curves must be corrected from standard air to the actual gas density.
Can I change a blower's performance without replacing it?
Yes, within limits. Changing speed with a VFD or pulley change shifts the whole curve according to the fan laws. Larger changes may need a different impeller.
What information should I give a manufacturer for blower selection?
Airflow, static pressure, gas temperature, density or altitude, dust and corrosive content, operating hours, power supply and space limits.